Things are changing in the EURUSD market. The pair’s current recovery momentum appears to be fading, while technical indicators suggest that the downtrend is likely to resume. At the time of writing, quotes are hovering around 1.14050. Yesterday’s Doji candlestick pattern, combined with today’s price decline, points to waning buying interest.
The Stochastic Oscillator confirms this scenario. Its lines exited oversold territory—where they had been during the drop to 1.13238—and climbed into the upper part of the channel. There is little room left for further upside, as %K has significantly exceeded %D, approaching the upper boundary of the neutral zone. Coupled with a reversal candlestick, this could be a solid reason for a pullback.
The On-Balance Volume Indicator tells the same story. It has moved upward in tandem with prices since June 24. However, the OBV turned downward on June 30. The current decline is not yet steep, but the fact that it coincides with a reversal pattern on the chart reinforces the suspicion that buying momentum is weakening faster than the price itself.
The Average True Range (ATR) continues to fall, reflecting reduced volatility. Taken together with reversal signals from the Stochastic and OBV, it shows us a picture of energy building for a downward move, not an upward one.
Fundamental factors align with the technical setup. Slower inflation in the eurozone hints that the region’s central bank is unlikely to be hawkish. Meanwhile, the new Federal Reserve’s (Fed) head, Kevin Warsh, remains determined to tame consumer prices. As a result, the market is now predicting a rate hike as early as this summer. The widening monetary gap between the two central banks keeps supporting the dollar, moving in lockstep with technical signals.
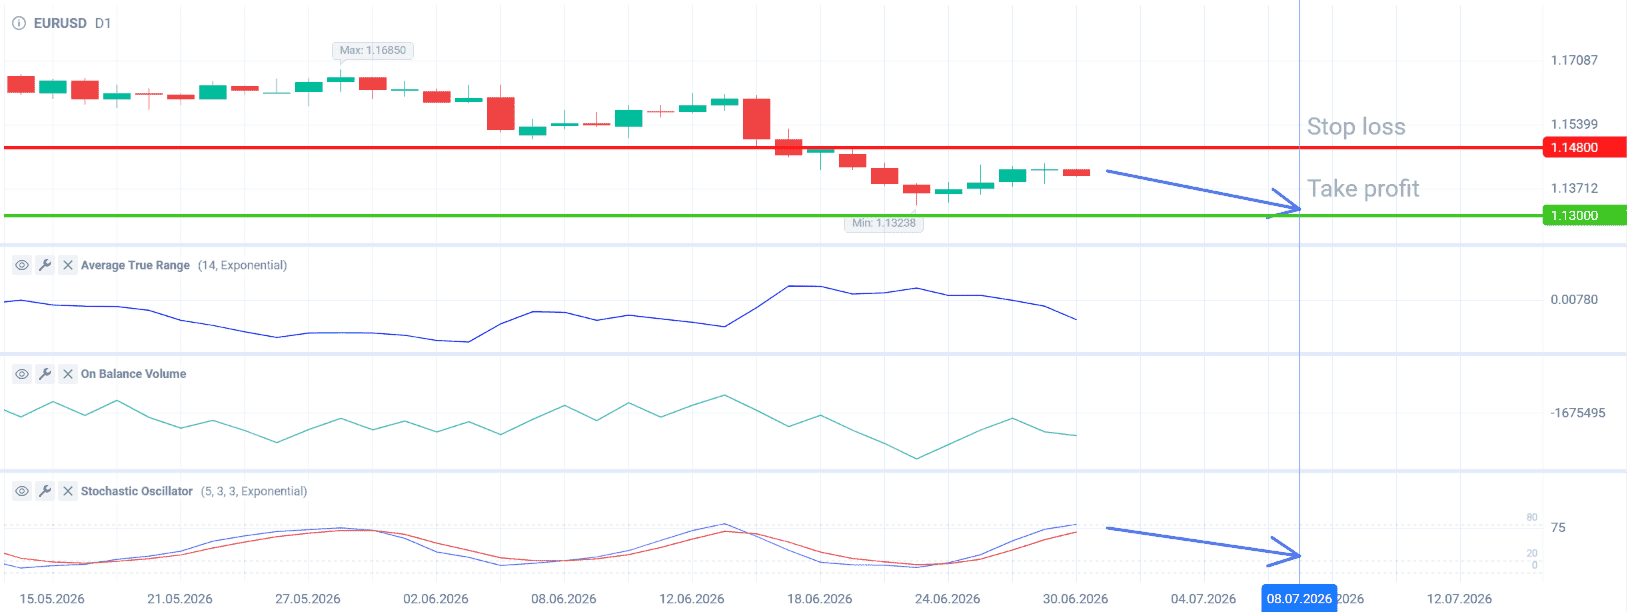
Pay attention to the trading plan down below:
Sell EURUSD from current levels. Place Take Profit at 1.13000 and Stop Loss at 1.14800.
This forecast remains relevant between July 1 and July 8, 2026.